Improving TTFB for Better Website Performance
Time to First Byte (TTFB) is a performance metric that measures how long it takes for the first byte of data to arrive in a user’s browser after they request a webpage.
TTFB is now an important part of site speed because of Core Web Vitals, which are Google’s metrics that measure how good a user’s experience on a website is. If your TTFB is low, pages will take longer to load, users will get angry, and your bounce rate will go up.
Google says that the TTFB should be less than 200 ms. Read on to learn some optimization tricks that can help lower your site’s overall TTFB.
TTFB’s role in web performance
It’s been seen that Time to First Byte impacts both the user experience and SEO. The page’s content may take longer to load, but TTFB makes it look like the page is loading fast.
The Chrome User Experience Report (CrUX) is part of Google’s Web Vitals project and tells you how real people really feel about your site. So, TTFB could help show more accurate web performance than synthetic tests.
Here’s Google’s dataset of real user metrics for measuring a site’s overall performance:

Tools vary in how they define TTFB, as some only focus on the time it takes during the actual HTTP request itself, not counting the time it takes to set up the connection to the server.
A TTFB score comprises network latency, server processing time, and the time it takes for the server to deliver the response.

Sites with a TTFB score of under 200 milliseconds have a more optimal web performance.
Side note: Because TTFB (Time to First Byte) isn’t one of the Core Web Vitals metrics, a site need not meet the “ideal” TTFB threshold as long as it doesn’t harm other notable performance scores.
How is TTFB measured
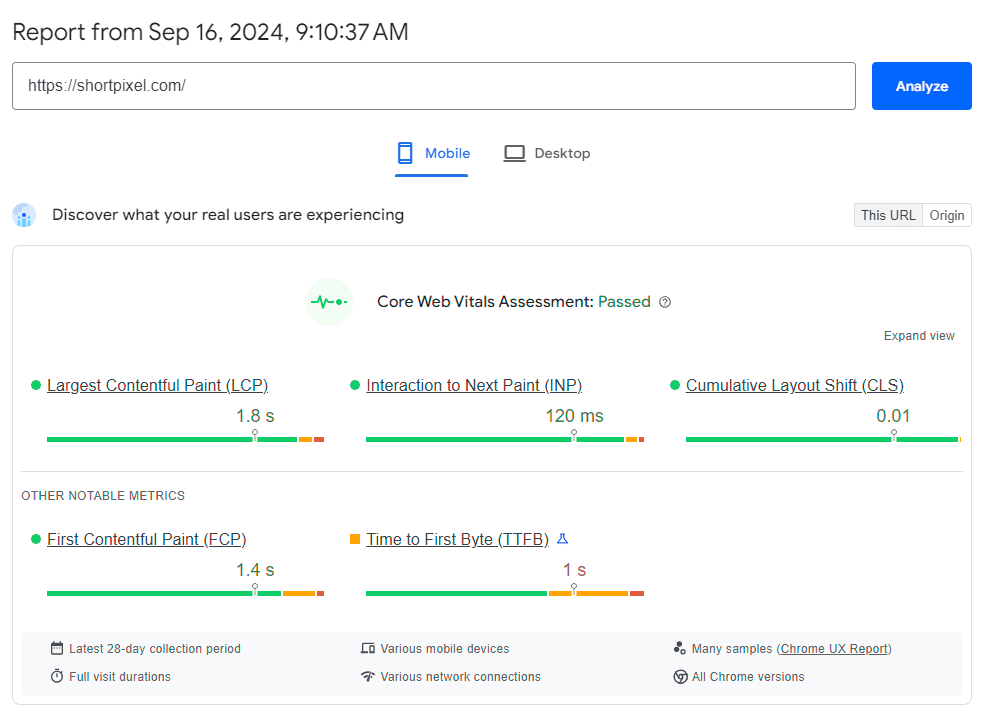
Tools like Google’s PageSpeed Insights are savvy at detailing TTFB for different devices, showing how fast your site responds across varying conditions in milliseconds (ms).
Here’s a report on how mobile visitors interact with the ShortPixel site:
When measuring TTFB, these steps take place in the background to optimize the site loading speed:
1. DNS Lookup: When you type a URL, your browser must first translate that URL into an IP address, which happens through the DNS (Domain Name System) lookup.
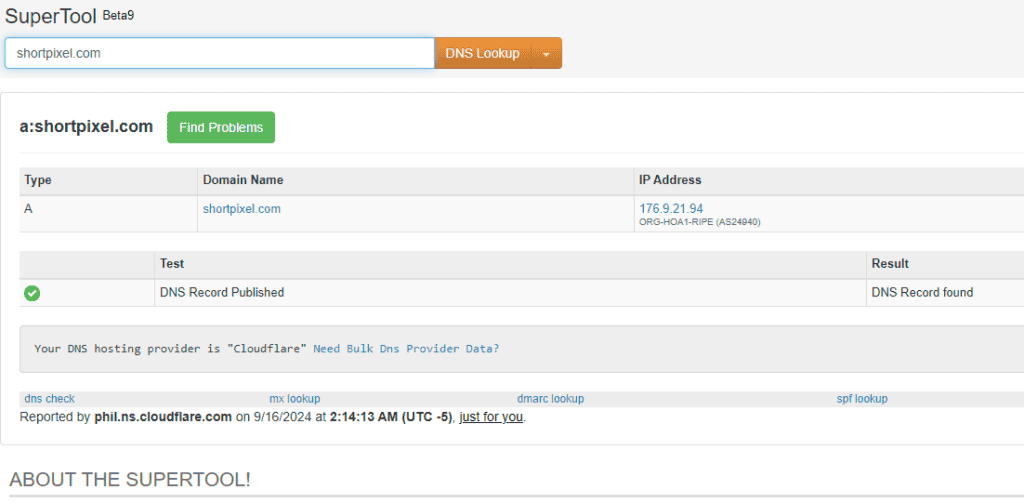
This lookup adds a slight delay to the request.
2. TCP Handshake: Once the IP address is found, your browser establishes a connection with the server using a process called the TCP (Transmission Control Protocol) handshake.
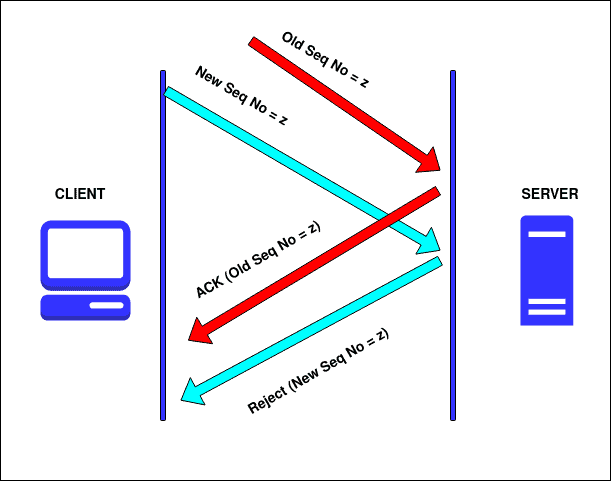
TCP handshake is where the browser and server agree on how they communicate.
3. Server Processing: After the connection is set up, the server needs to process the request. The speed of this step depends on how optimized the server is, including how quickly it can handle requests and fetch the necessary data.
4. Response Transmission: Once the server processes the request, it sends the first data byte back to the browser. The overall duration here depends on your network speed and server performance.
You’ll also find that TTFB isn’t just a measurement of server speed. CDNs (Content Delivery Networks) and caching strategies also help curb delays caused by server distance and network congestion.
Essential components of TTFB
Here are the key elements that determine how fast the first byte of data reaches a user’s browser:
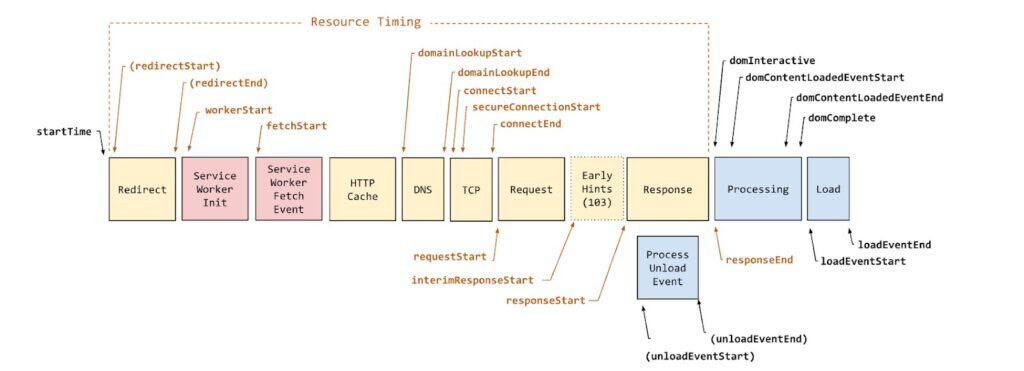
1. Network latency
Network latency is the delay when data travels between the user’s browser and your site’s server.
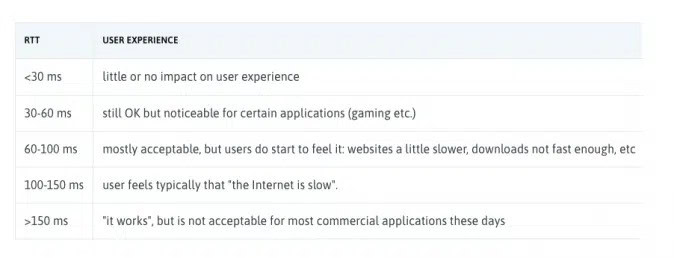
Latency of less than 100-150 ms is doable, but aim for 30-40ms if you want optimal performance.
2. Server processing time
The server’s time to generate the requested response often depends on its efficiency in handling database queries, running scripts, or performing tasks like user authentication.
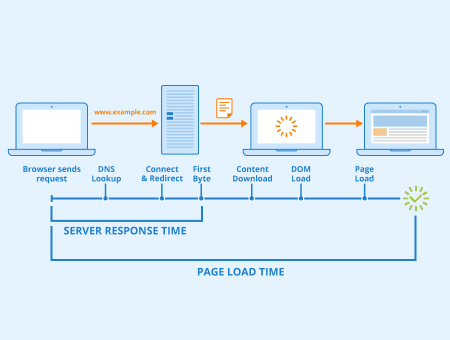
A fast server response lowers TTFB while improving metrics like First Contentful Paint (FCP) and overall site speed.
Database issues, inefficient server configuration, and a lack of caching could slow the response time.
3. Response transmission time
Once the server generates the response, the data is sent back to the user’s browser. Things like network bandwidth, connection speed, and server load will impact the transmission speed.
Top factors affecting TTFB
1. Server location and distance from the user
If the server is located far from the user, it adds latency, or delay, to this process.
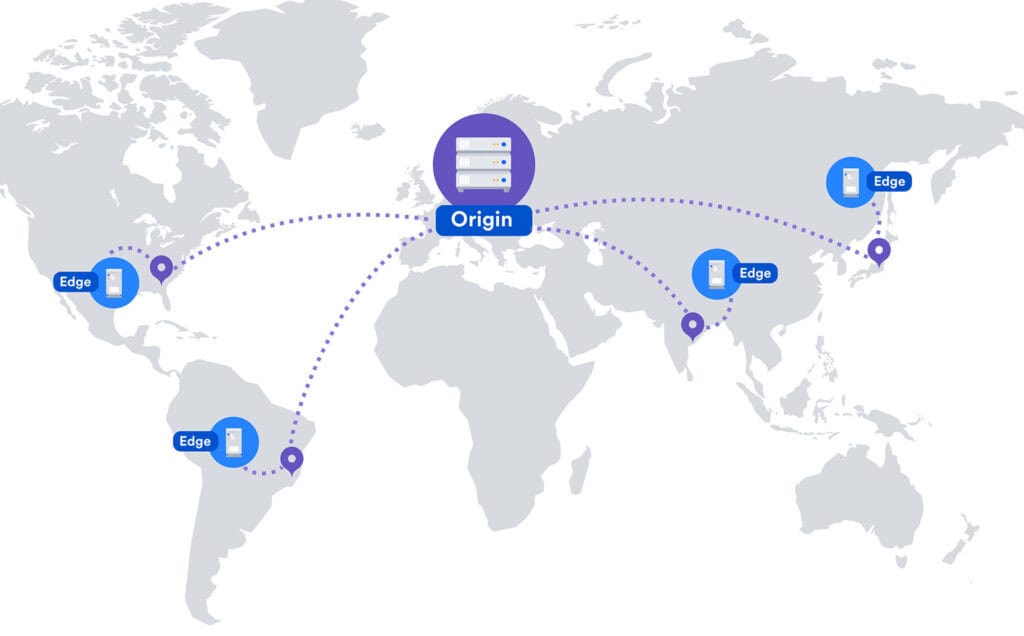
For instance, if your server is based in New York and a user from Tokyo tries to access it, the delay due to distance will be noticeable.
To combat this, you could use ShortPixel’s CDN to distribute copies of your site across multiple global servers.
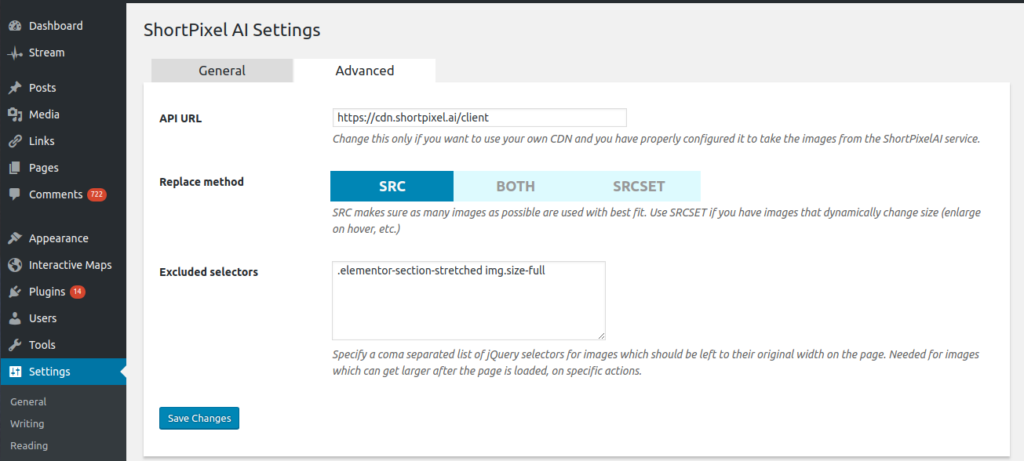
As a result, users can access data from a server closer to them, which helps reduce TTFB.
2. Server hardware and resources
A high-performance engine gets you to your destination faster.
Similarly, a server with robust hardware—like powerful CPUs, ample RAM, and fast SSDs—can process requests more quickly, reducing TTFB.
Your site will take longer to handle incoming requests if it’s struggling with limited resources.
3. Caching strategies
Caching is like having pre-prepared meals ready to go. Object caching, for instance, stores frequently accessed data, allowing for faster retrieval without regenerating it each time.
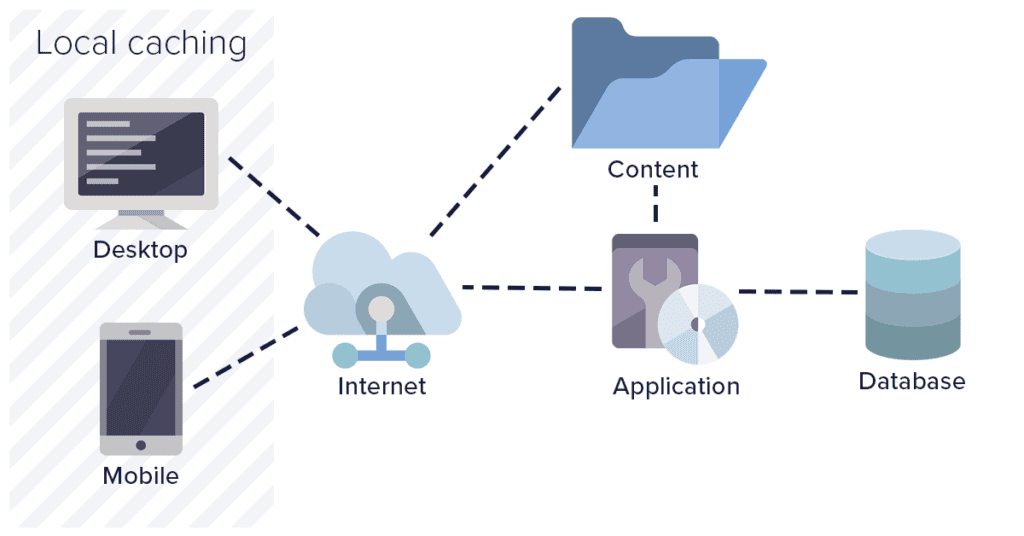
On the other hand, page caching saves fully rendered pages so that they don’t need to be processed from scratch for each request, which is especially useful for high-traffic sites.
Consider CDN caching to distribute cached content across multiple locations while minimizing latency.
Tools for measuring TTFB
There are many tools for measuring the TTFB metric, but my favorite is Chrome Devtools. Here’s how to get started:
1. Browser developer tools
There are many tools for measuring the TTFB metric, but my favorite is Chrome Devtools. Here’s how to get started:
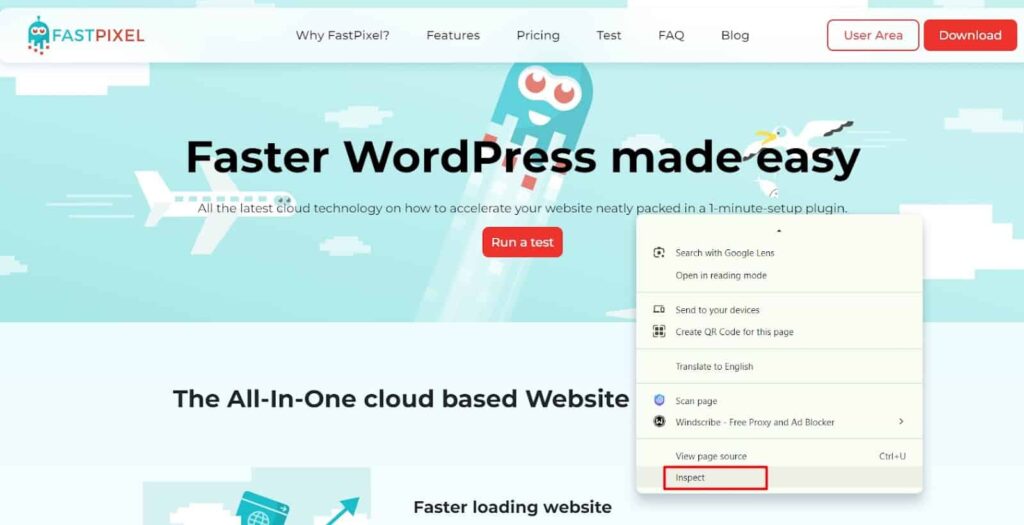
Step 1: Right-click anywhere on the page and select “Inspect” from the context menu.
Step 2: In Chrome DevTools, you’ll see a Network tab that displays all network requests made by the webpage.
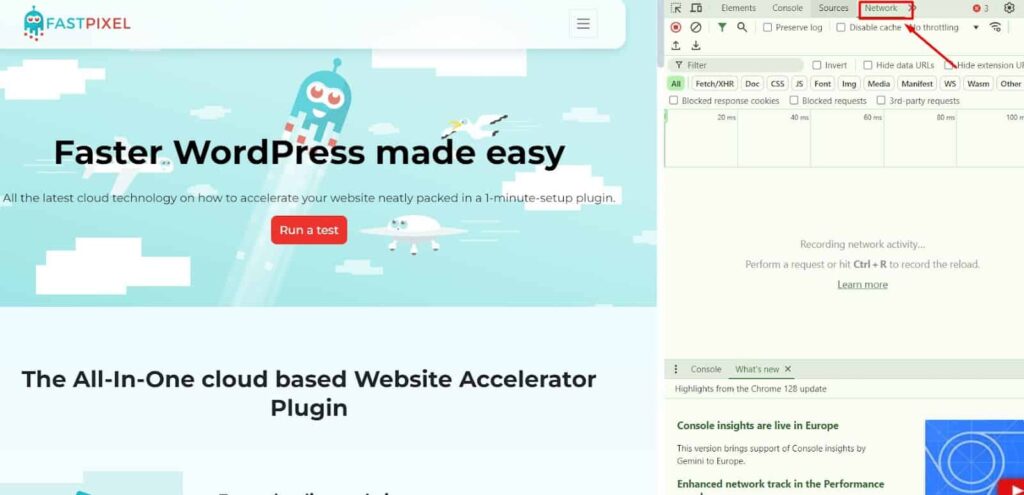
Step 3: Reload the page so DevTools can capture all network requests immediately. It helps measure TTFB accurately.
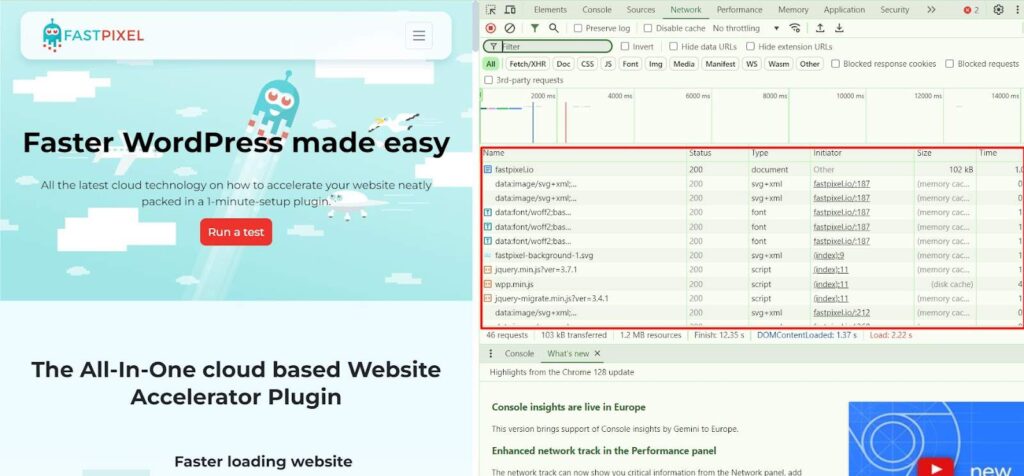
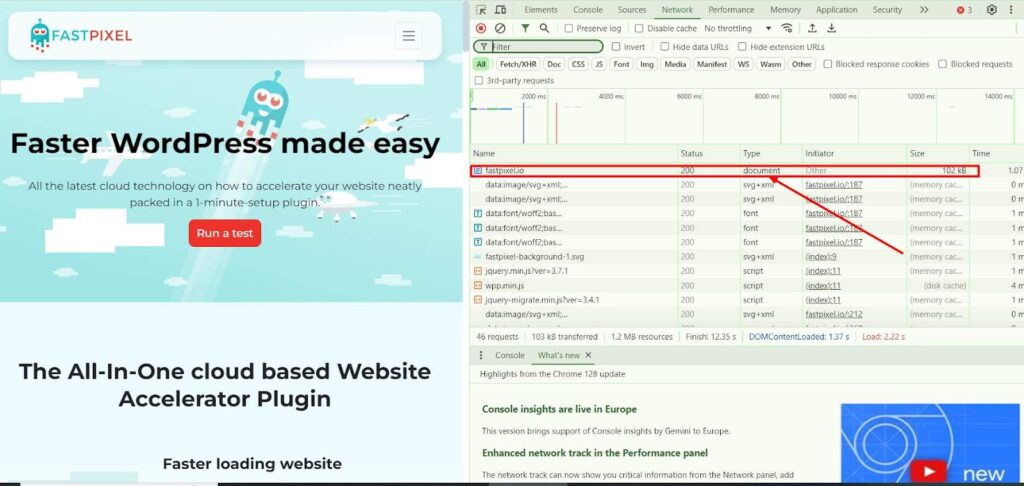
Step 4: Locate the resource you want to analyze in the Network tab. If you wish to measure TTFB, focus on the main HTML document. It’s usually the top item or one with the document format.
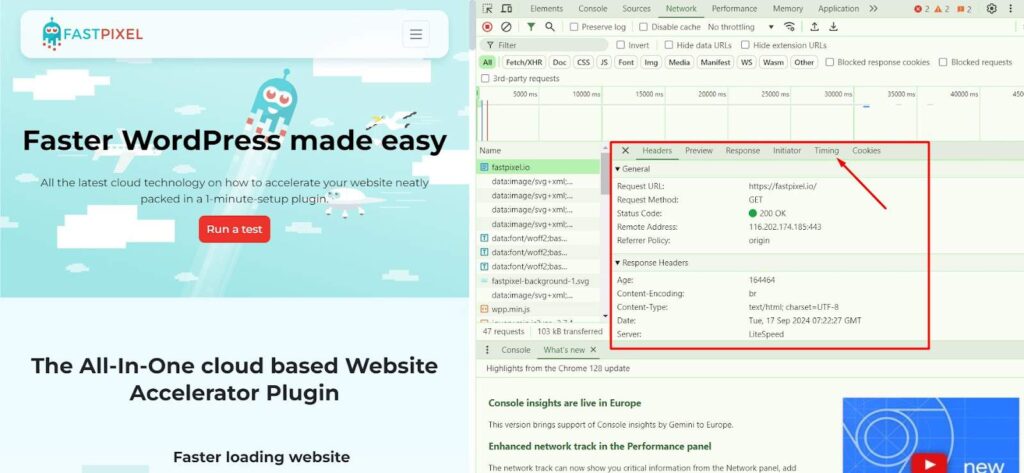
Step 5: Click on the main HTML request from the list to access the “Timing” tab in the panel that opens. Apart from TTFB, this tab breaks down different phases of the request.
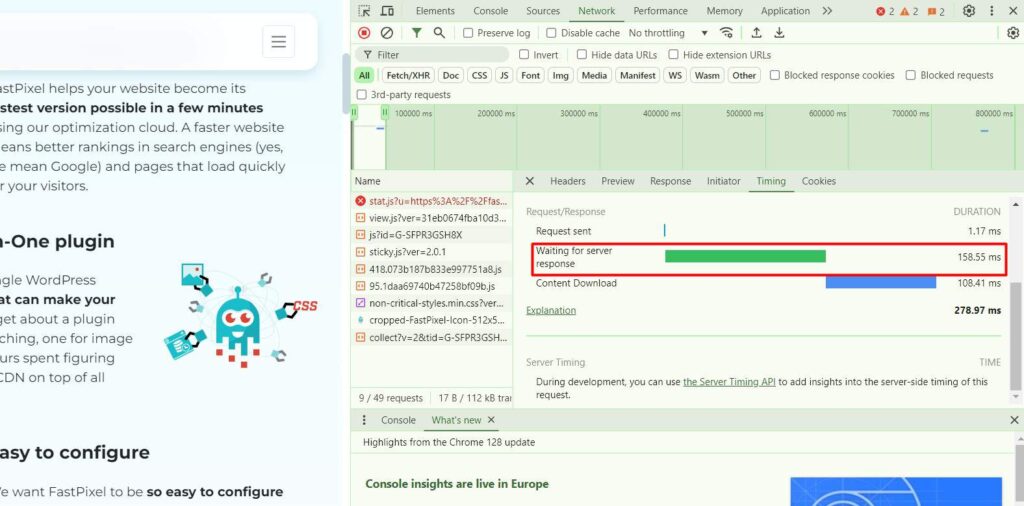
Step 6: Go to the “Waiting (TTFB)” section in the Timing tab. You’ll see the TTFB value, which is the time it takes for the server to receive the first byte of the response.
You might consider exploring other DevTools, such as Performance or Lighthouse, for a more in-depth TTFB analysis.
2. Online speed test tools for measuring TTFB
Speed testing tools like Pingdom, GTmetrix, and WebPage Test are reliable at assessing your site’s overall TTFB, but my favorite is Google PageSpeed Insights.
And here’s why:
Once the analysis is complete, you receive a detailed diagnosis. There’s also an “Opportunities” section that shows areas for improvement.
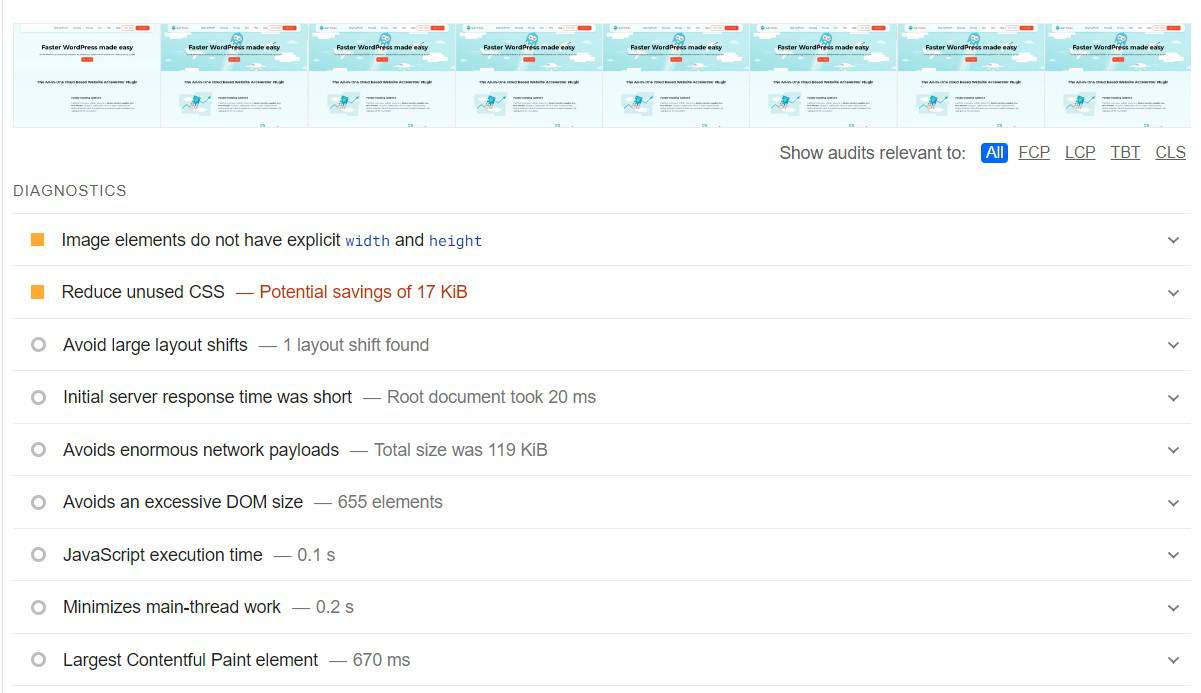
This section addresses TTFB issues, and you can check if the report flags server response time.
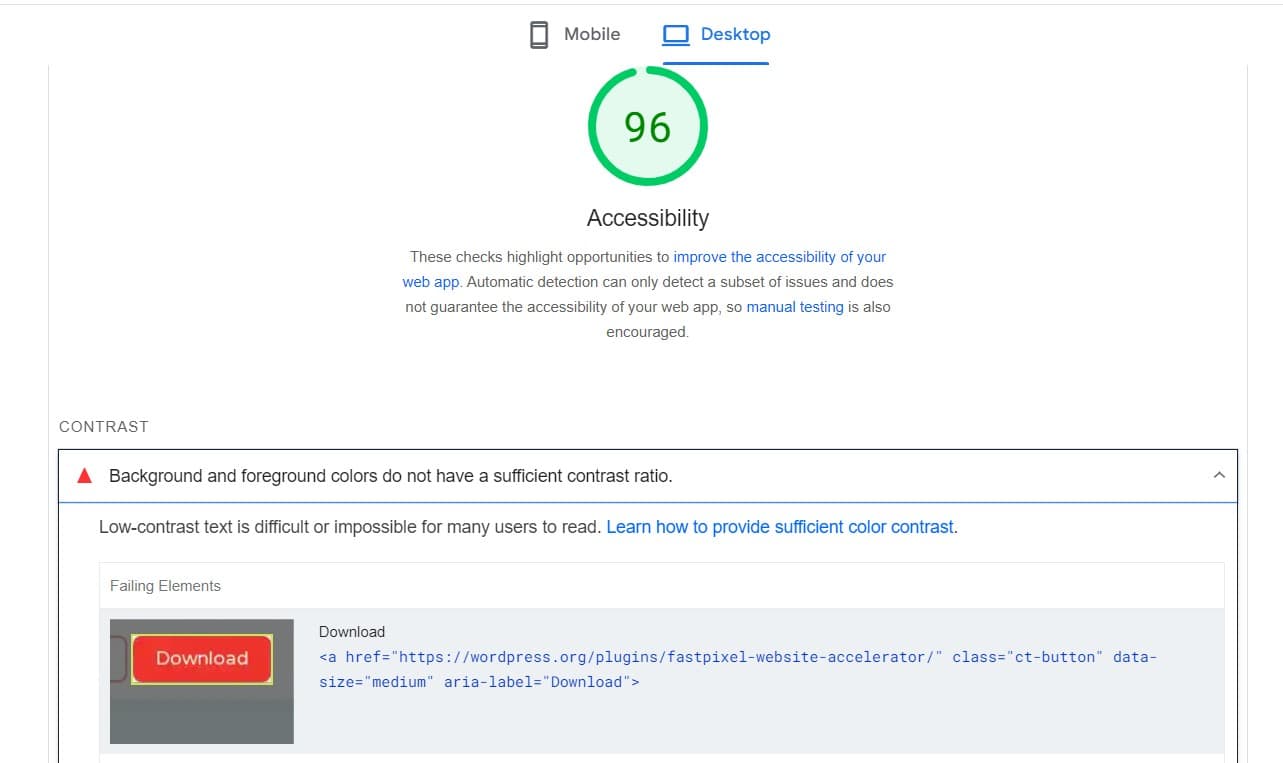
A few typical recommendations we’ve seen while testing sites include using a Content Delivery Network (CDN), enabling server-side caching, and even optimizing server configurations.
3. Server-side monitoring tools
Server-side monitoring tools like New Relic, Datadog, or Prometheus help break down every step of the request process so you can pinpoint what’s slowing down the first byte.
Datadog, for instance, is useful for debugging performance issues and monitoring server metrics.
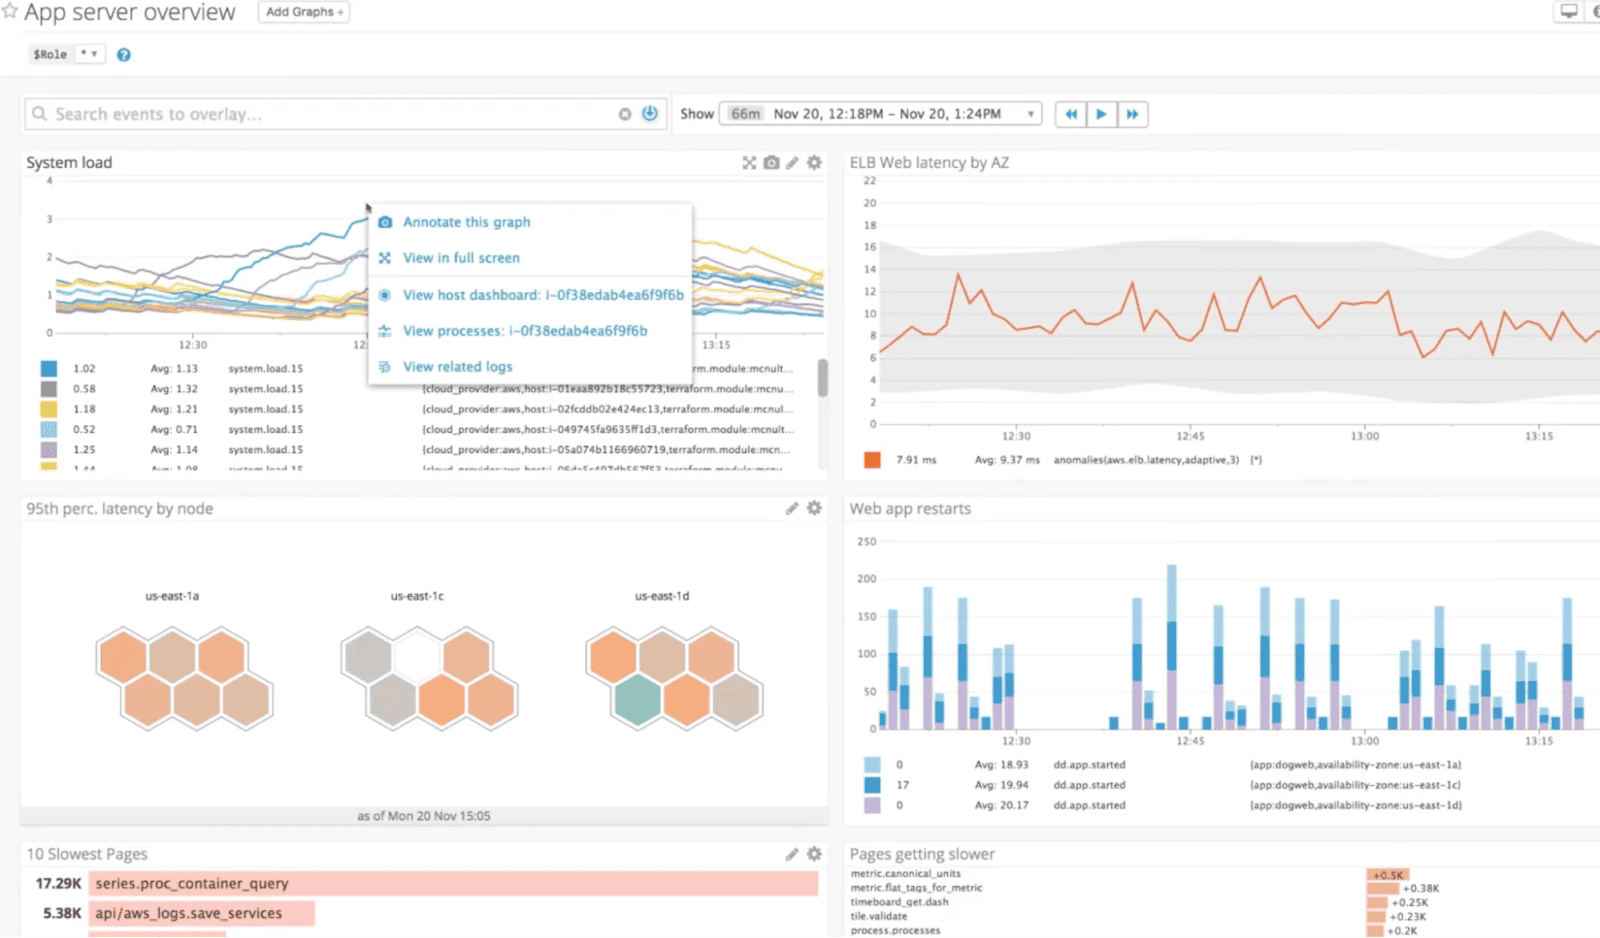
Without a monitoring tool, you can’t tell whether DNS Lookup or TCP Handshake is taking longer to respond. That sudden TTFB spike could result from server overload, which is easy to identify with Datadog’s real-time alerts.
How to interpret TTFB results
If your site’s TTFB is tweaked right, you should expect faster load times, better user experience, and higher SEO rankings. But, interpreting these results takes more than just looking at a single number.
Here’s how to make sense of TTB data:
1. Understanding the metrics
We mentioned that TTFB is measured in milliseconds (ms), and here’s what the metrics mean:
- < 200ms: Excellent. Your server is highly responsive.
- 200ms – 500ms: Good, but there’s room for improvement.
- > 500ms: Needs attention. The server is slow in delivering the first byte, which can negatively impact user experience.
For context, if you’re seeing a TTFB of 300ms, your site is doing relatively well, but there may still be optimizations to shave off milliseconds and speed up the experience further.
2. Identifying bottlenecks
Server location and processing are typical culprits of TTFB slowdown. For instance, site users far from the server may experience high TTFB, which is common for global sites with a single server location.
High TTFB could signal that your server takes longer than usual to process requests. If processing times are sluggish, some bottlenecks worth diagnosing include inefficient code, slow database queries, or an underpowered server.
3. Correlating TTFB with other performance metrics
TTFB is just one part of the web performance puzzles, so it’s worth looking at how it correlates with these other key metrics:
First Contentful Paint (FCP): This measures when the first piece of content appears on the screen.
As illustrated in the loading timeline below, the First Contentful Paint (FCP) occurs in the second frame, as that’s when the first visible text and image elements appear on the screen.
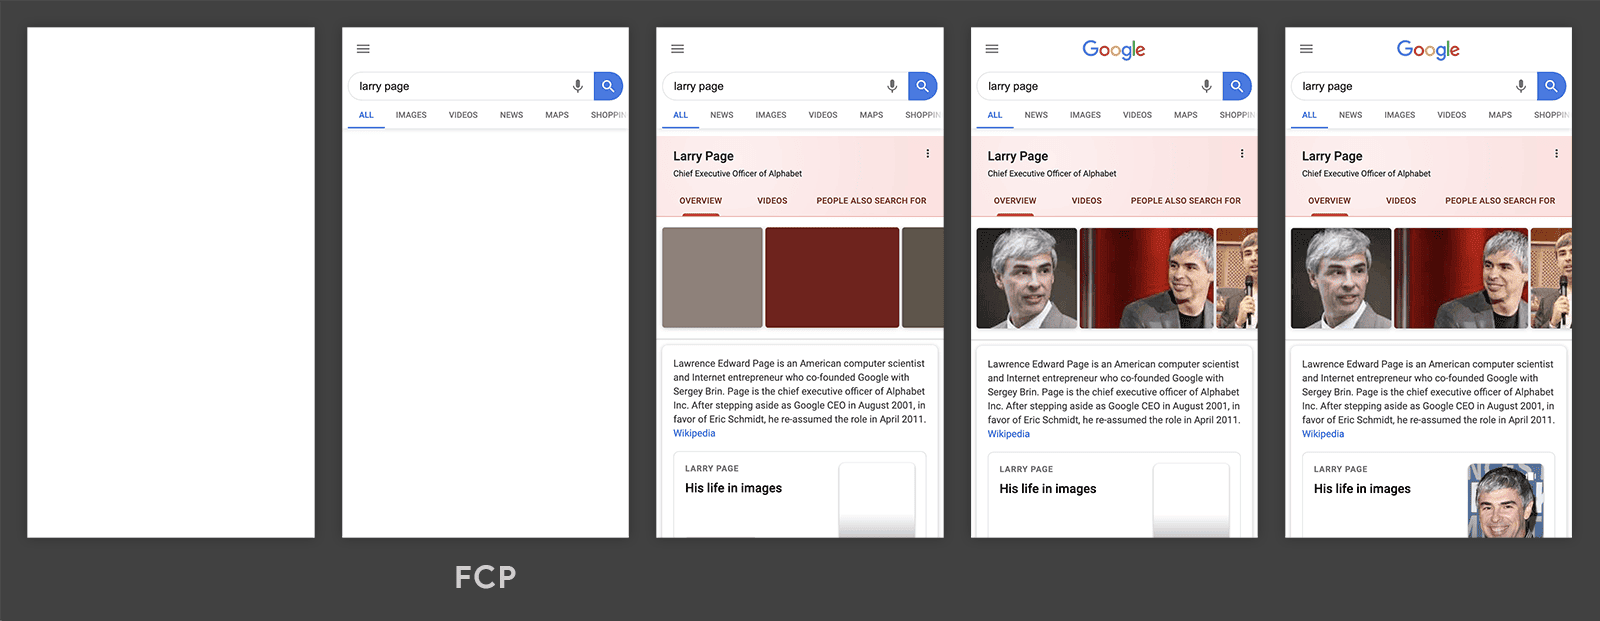
An FCP value of 1.8 seconds or less is considered good, while anything over 3.0 seconds is poor.
A low TTFB often correlates with a faster FCP because the browser receives and displays content more quickly.
TTFB also correlates with Largest Contentful Paint (LCP) as it measures how quickly the largest visual content element on the page loads. If your TTFB is slow, LCP will likely be delayed, and site visitors will struggle with a poor user experience.
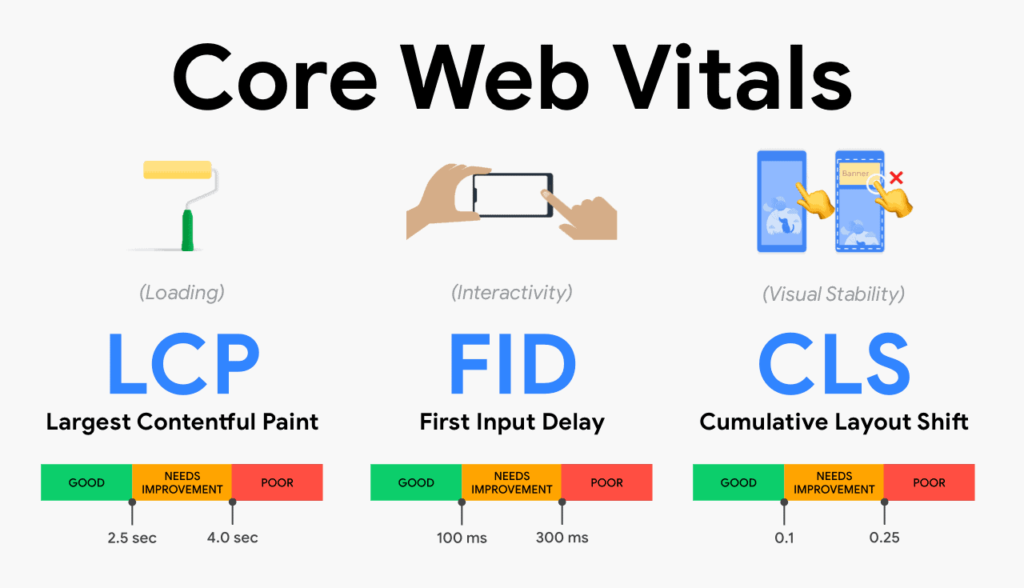
While TTFB isn’t a Core Web Vitals metric, optimizing TTFB can indirectly improve them, especially FCP and LCP, as server response time impacts their results.
Industry benchmarks and standards for measuring TTFB
We looked at Google and Amazon as case studies on how they optimize TTFB, and here are our findings:
1. Google’s recommendations
Google insists that TTFB isn’t the sole factor in site performance. Your site will run optimally even if it doesn’t hit the “good” TTFB threshold so long as the more crucial Core Web Vitals metrics (FCP, LCP, etc.) aren’t interfered with.
Single-page applications (SPAs), for instance, might require the lowest possible TTFB, but server-rendered sites tend to have slightly higher TTFB if the rest of the content loads efficiently.
Google also recommends optimizing server response times using clean code and delaying the loading of non-essential content (lazy loading). You could use ShortPixel’s lazy loading feature to help improve the overall TTFB.
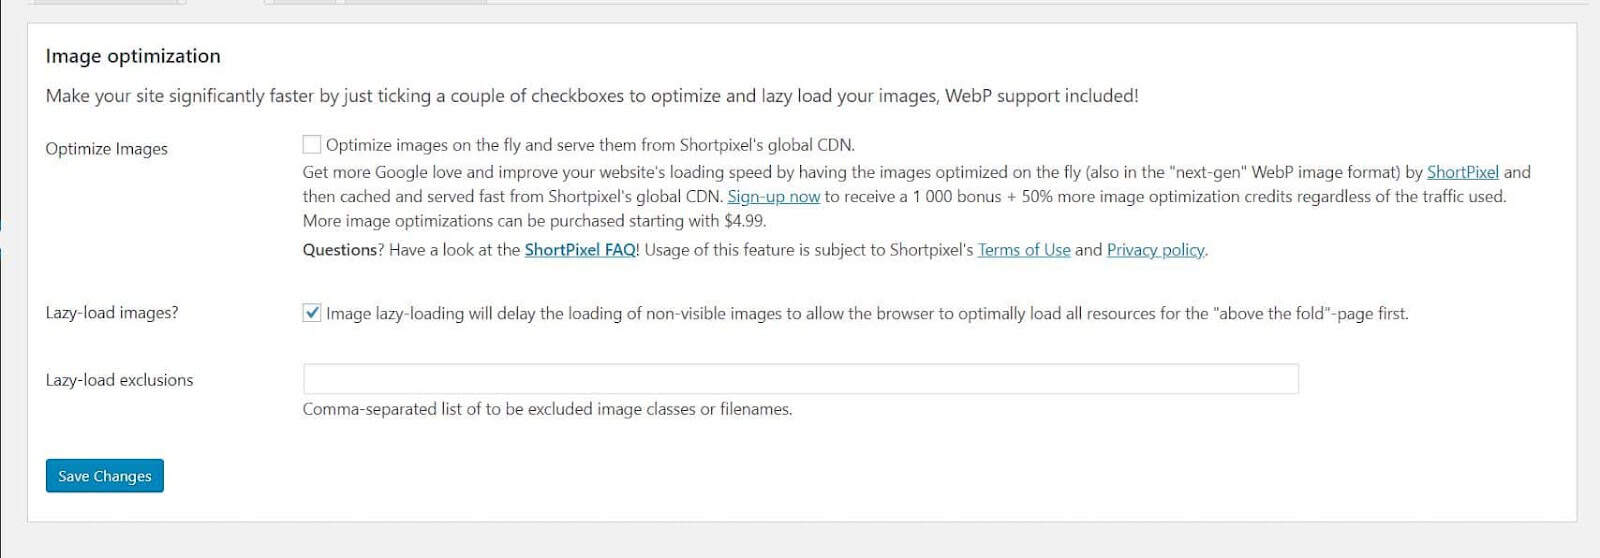
Browser caching, using Content Delivery Networks (CDNs), and implementing server-side caching are also on Google’s checklist when computing the time it takes to generate a response.
2. Amazon’s TTFB performance tools
Amazon prefers using Server-Timing Headers to measure the different phases of request processing, such as DNS lookup, TCP connection, SSL handshake, and server response.
These headers are savvy at assessing how long each part of the request takes, and that’s valuable to a site owner who wants to pinpoint where performance issues are arising.
For e-commerce businesses in software distribution and video streaming, the Amazon CloudFront would be a viable CDN as it offers low-latency access to data across multiple locations.
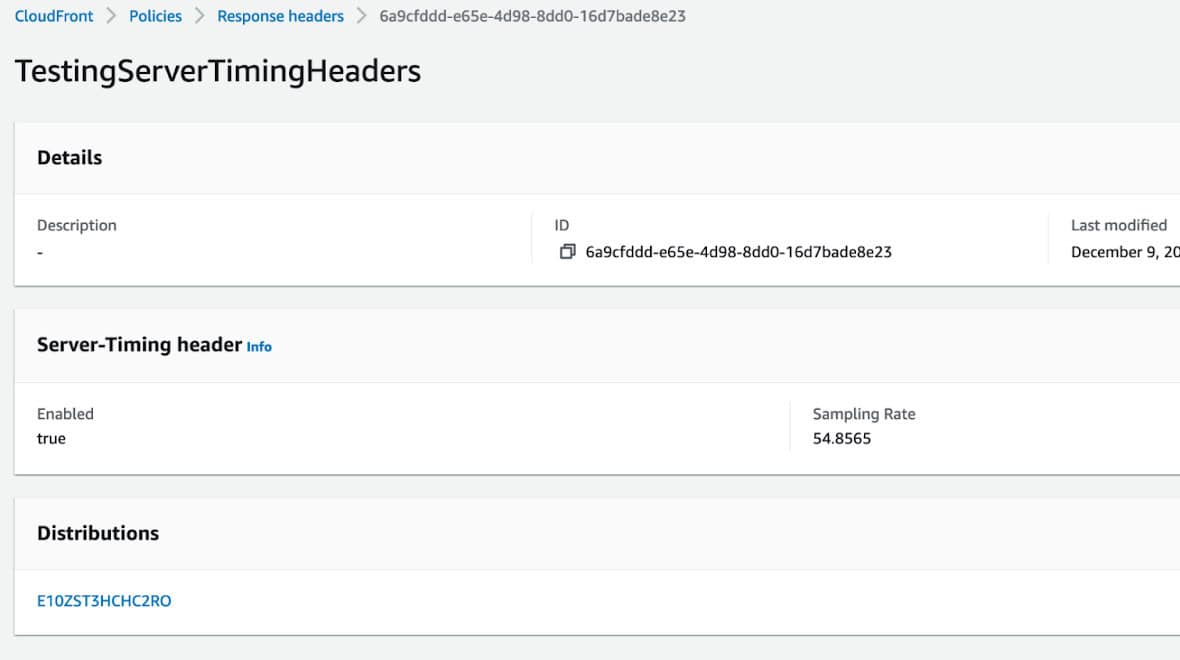
Using CloudFront to cache content at an edge location in Asia, the data is served from a nearby server, reducing latency and improving TTFB.
You could also leverage Amazon’s AWS Global Accelerator to route traffic more across the AWS network.
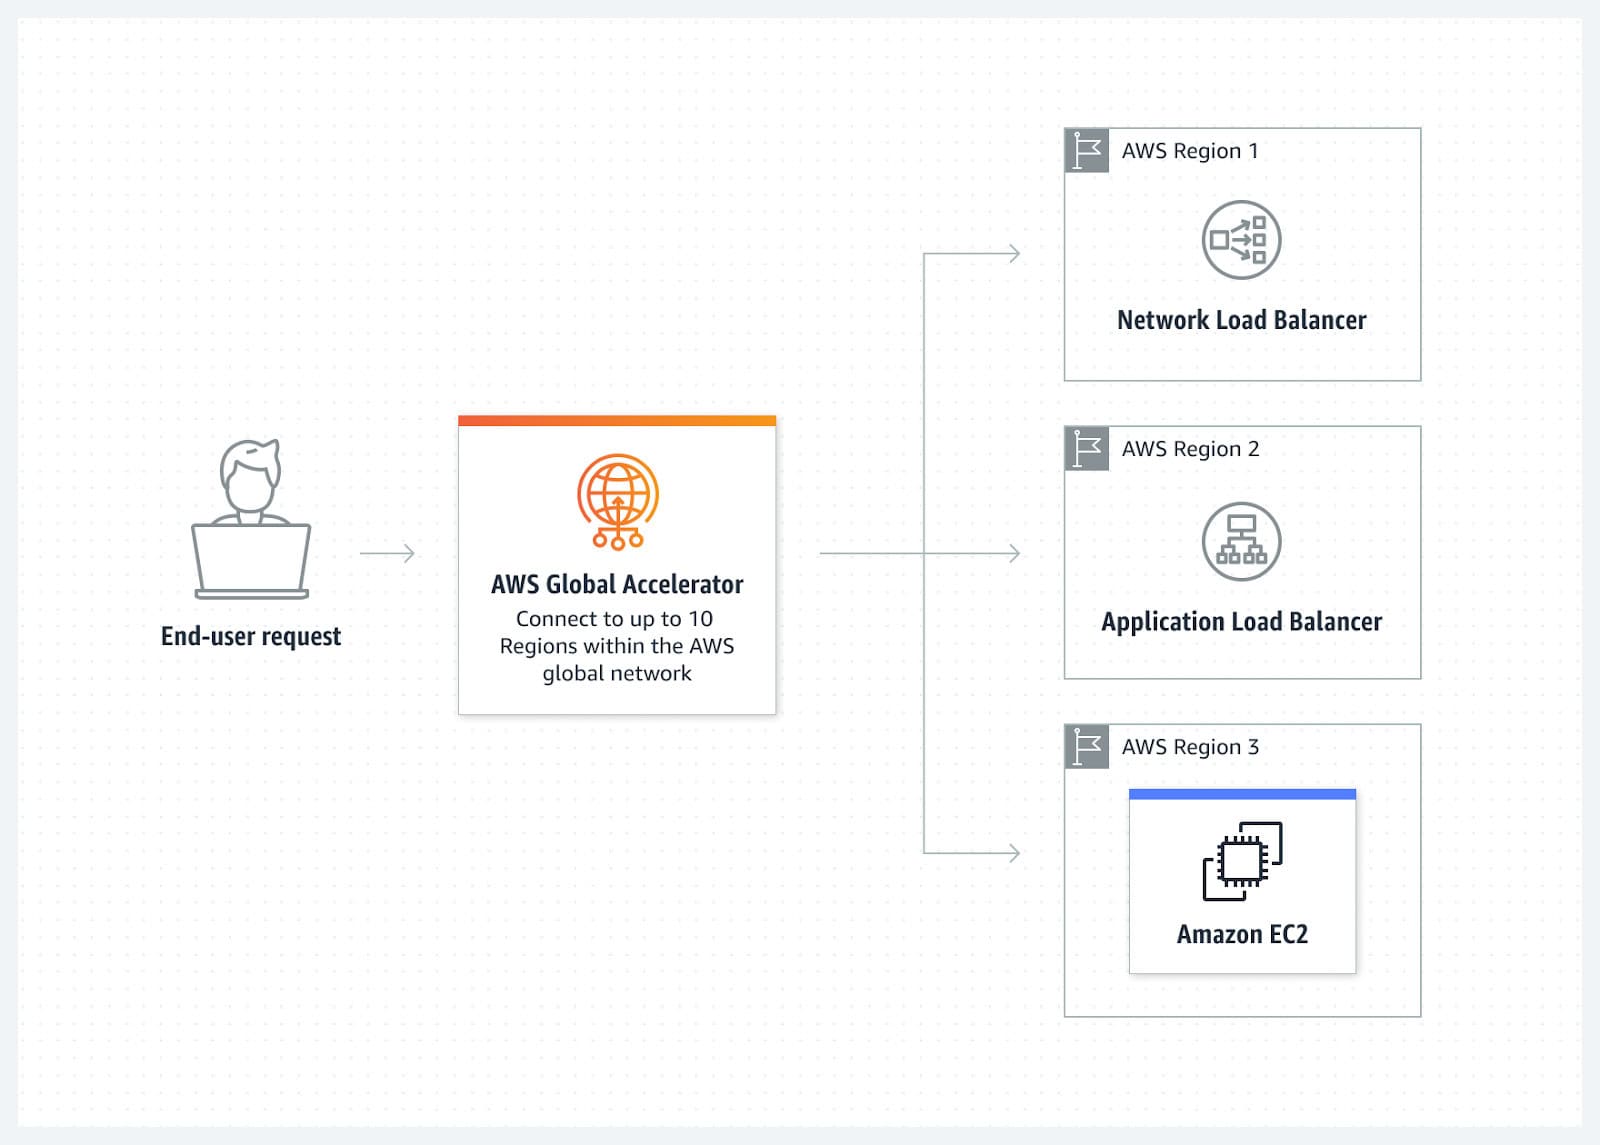
The goal is to reduce network latency by optimizing the routing path between users and servers. If the data has to travel through a congested or slow network, TTFB will be higher.
But, with Global Accelerator, traffic is routed through the fastest available paths, reducing the time for the first byte of data to be transmitted.
Detailed impact analysis of TTFB
1. Correlation between TTFB and page load
A slow TTFB can delay the First Contentful Paint (FCP) and Largest Contentful Paint (LCP), resulting in longer load times. When page rendering is delayed, this could lead to poor Core Web Vitals scores.
For example:
- First Input Delay (FID): Though FID measures interactivity, a long TTFB can make the site appear unresponsive, indirectly influencing FID.
- Largest Contentful Paint (LCP): A slow server response can delay the largest image or text block, leading to poor LCP scores.
2. Effect on user experience
Akamai’s online retail performance report shows that a 100ms delay in load time can reduce conversion rates by 7%.
E-commerce sites with slower TTFB see higher abandonment rates, and Kissmetrics suggests that 40% of users will leave a site if it takes more than 3 seconds to load.
Amazon, for instance, famously discovered in 2006 that for every 100ms of latency added to its page load time, it lost 1% in sales.
Key takeaway: Enhance TTFB even by a few milliseconds and expect users to complete a purchase, fill out forms, or engage with content on your site.
3. Impact on bounce rates
Landing page redirects increase TTFB, leading to longer response times and higher bounce rates. Backlinko found that reducing redirects could boost load times by up to 20%.
Consider compressing resources like HTML, CSS, and JavaScript files for faster first bytes. Compression tools like Gzip can reduce file sizes by up to 70%, shrinking the amount of data the server sends.
I’d also prioritize visible content above the fold (lazy loading) to allow users to interact with the site sooner, even while other elements load in the background.
Monitoring TTFB
Running regular performance audits and gathering user feedback are viable ways to monitor and improve TTFB.
1. Regular performance audits
In addition to tools like Google Page Insights and Chrome DevTools, you could also utilize WebPage Test for a detailed TTFB breakdown.
Running a performance audit on this tool is as simple as entering your website URL and choosing a test location.
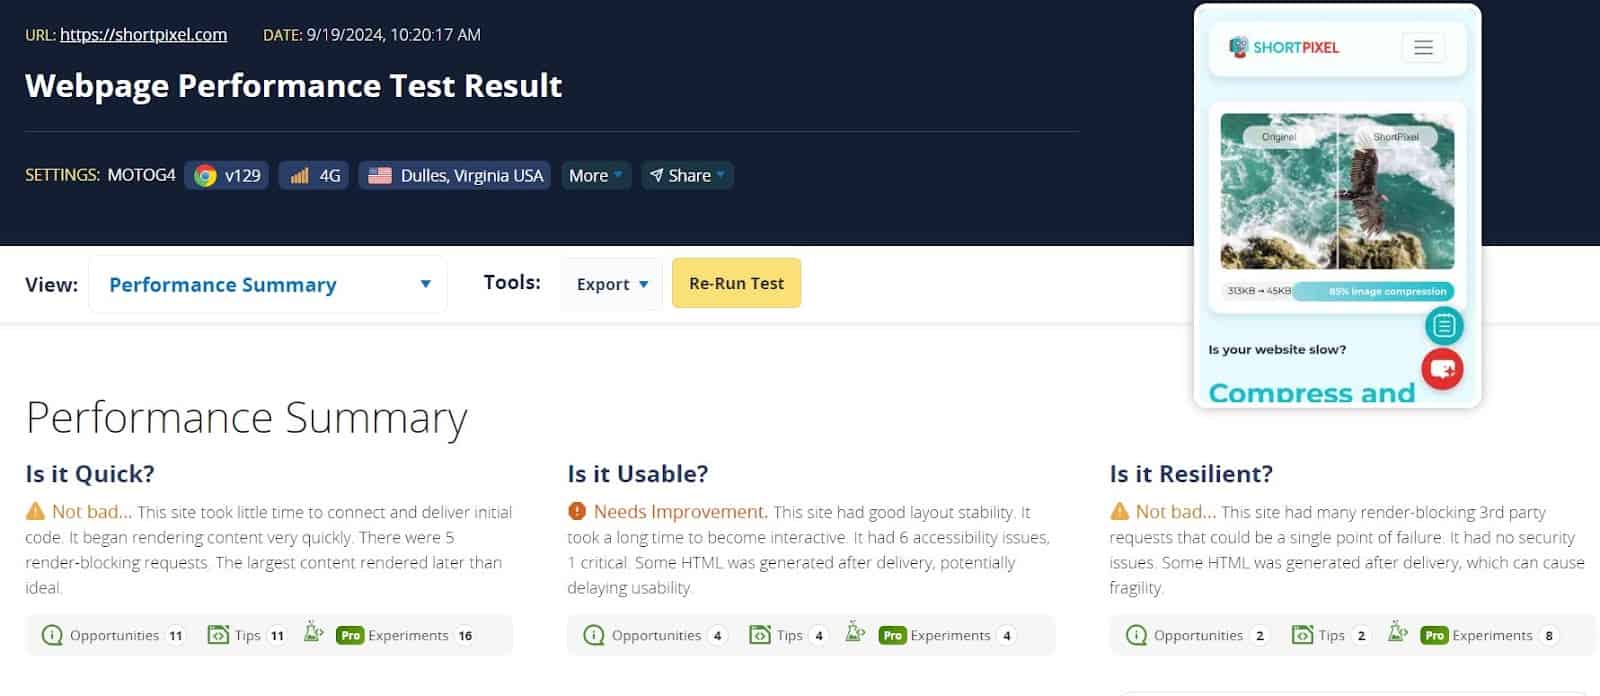
Here, you’ll have a visual breakdown of the load time, including DNS lookup, connection, and SSL negotiation times.

As you can see, these page performance metrics should help identify slow server-side issues, tweak slow-loading resources, and assess the impact of third-party scripts.
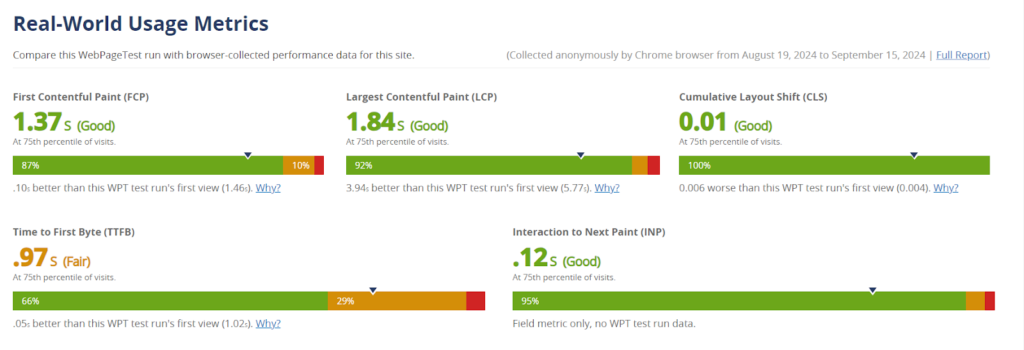
You also have key insights into your site’s performance under different conditions and what truly matters to your users. That’s useful for adapting to changing traffic patterns and tracking the update of updating code, adding plugins, or modifying server settings.
2. User feedback and real-world testing
User feedback identifies performance bottlenecks that may not always appear in synthetic tests.
If, for instance, you’re running an e-commerce site, use tools like Google Forms, Typeform, or Hotjar to ask users whether pages take too long to load, especially during specific actions like adding items to a cart or submitting forms.
You could also use a free tool like Microsoft Clarity to access heat maps and session recordings of visitors’ interactions with your site.
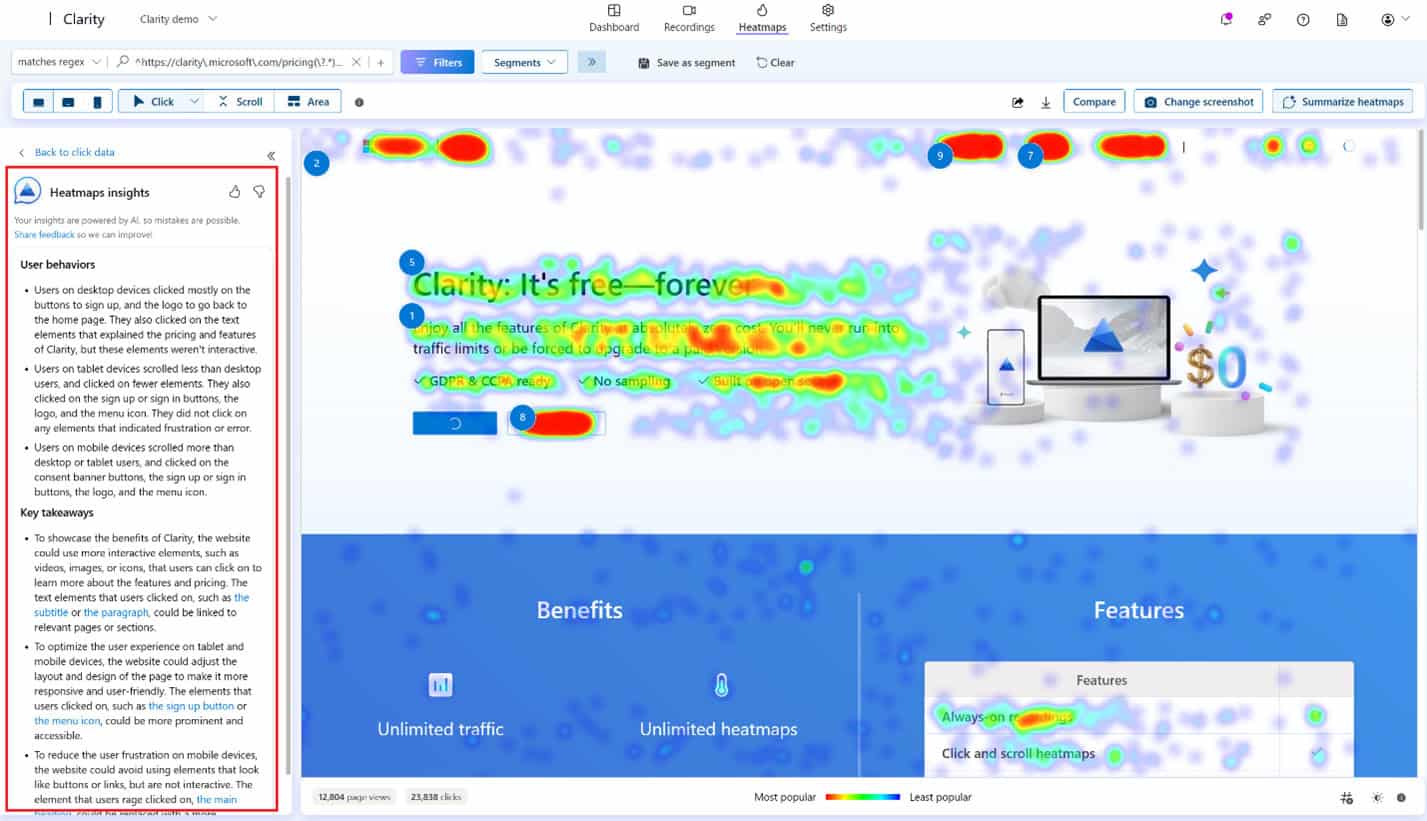
A heat map visually tracks where users spend most of the time or abandon your page. If the user interaction halts at certain points, it could signal a high TTFB, causing a delay in rendering the page’s content.
Key takeaways on optimizing TTFB on WordPress
1. Optimize the hosting environment
Fine-tuning your server settings for WordPress hosting environments like Kinsta or SiteGround is key.
These hosts are usually optimized for performance right out of the box, but tweaking a few things like using the latest PHP versions, enabling OPcache, and making sure GZIP compression is on will really help reduce your TTFB.
You want to make sure Keep-Alive is turned on so your server can handle multiple requests over the same connection. It’s a simple tweak that can speed up how quickly requests get processed.
Tools like Query Monitor are great for spotting slow database queries, and outdated PHP functions. Fixing these bottlenecks directly in your WordPress setup can make all the difference.
2. Boost network performance
Look into DNS services like Cloudflare for quicker resolution times. Plus, with Cloudflare’s free plan, you get bonus features like CDN support and extra security, which can really help reduce latency.
It’s also important to make sure your hosting provider has HTTP/2 and HTTP/3 support, as these protocols handle requests more efficiently. Most managed WordPress hosts already have this enabled, but if yours doesn’t, it might be time to consider a switch.
Also, double-check that your hosting plan has enough CPU, memory, and bandwidth to handle traffic spikes. This helps avoid server overloads that could slow down your TTFB.
3. Minimize third-party scripts and external requests
WordPress sites often rely on third-party resources like social media widgets, ads, and analytics. Try cutting down on the number of external services and make sure you’re loading only the essentials asynchronously. This can really help lower your TTFB.
If you’re using popular libraries like jQuery, self-hosting them is a smart move. It can speed up delivery, especially for mobile users, making the overall experience smoother.
4. Optimize WordPress site architecture
WordPress is infamous for plugin overload, which can bog down your backend and spike your TTFB. Take the time to assess your plugins and get rid of any that are unnecessary or redundant. Whenever possible, go for multi-purpose plugins to reduce the strain on your server.
Regularly optimizing your database is another easy win. Plugins like WP-Optimize can help clean up any overhead, get rid of unnecessary data, and speed up your database queries.
Choosing a lightweight, well-coded theme is also key. Themes like Hello or Astra are great options optimized for performance. Avoid themes that are loaded with extra features or built-in plugins that could slow your site down.
Finally, make sure you’re using an accelerator plugin like FastPixel that can help cut down on the amount of data your site processes during the initial load, which can help lower your TTFB.
5. Use a CDN
A CDN like Cloudflare, KeyCDN, or StackPath can greatly improve TTFB by caching static content like images, CSS, and JavaScript closer to the user’s geographic location.
Many WordPress caching plugins offer integration with CDNs, including FastPixel, allowing you to enable this with minimal setup.
Summary
Be consistent with monitoring and optimizing your TTFB, using tools like WebPageTest to measure current performance. Implement key optimizations like load balancing, caching, and DNS improvements. You also want to test your site regularly with real-world user feedback.
Your priority as the site owner is ensuring a faster, more engaging user experience, driving better retention, and targeting higher conversions.
Give FastPixel a try for free
Take the first step towards a faster website today and give FastPixel a try!