
How Page Speed Affects Conversions, Bounce Rate, and Revenue

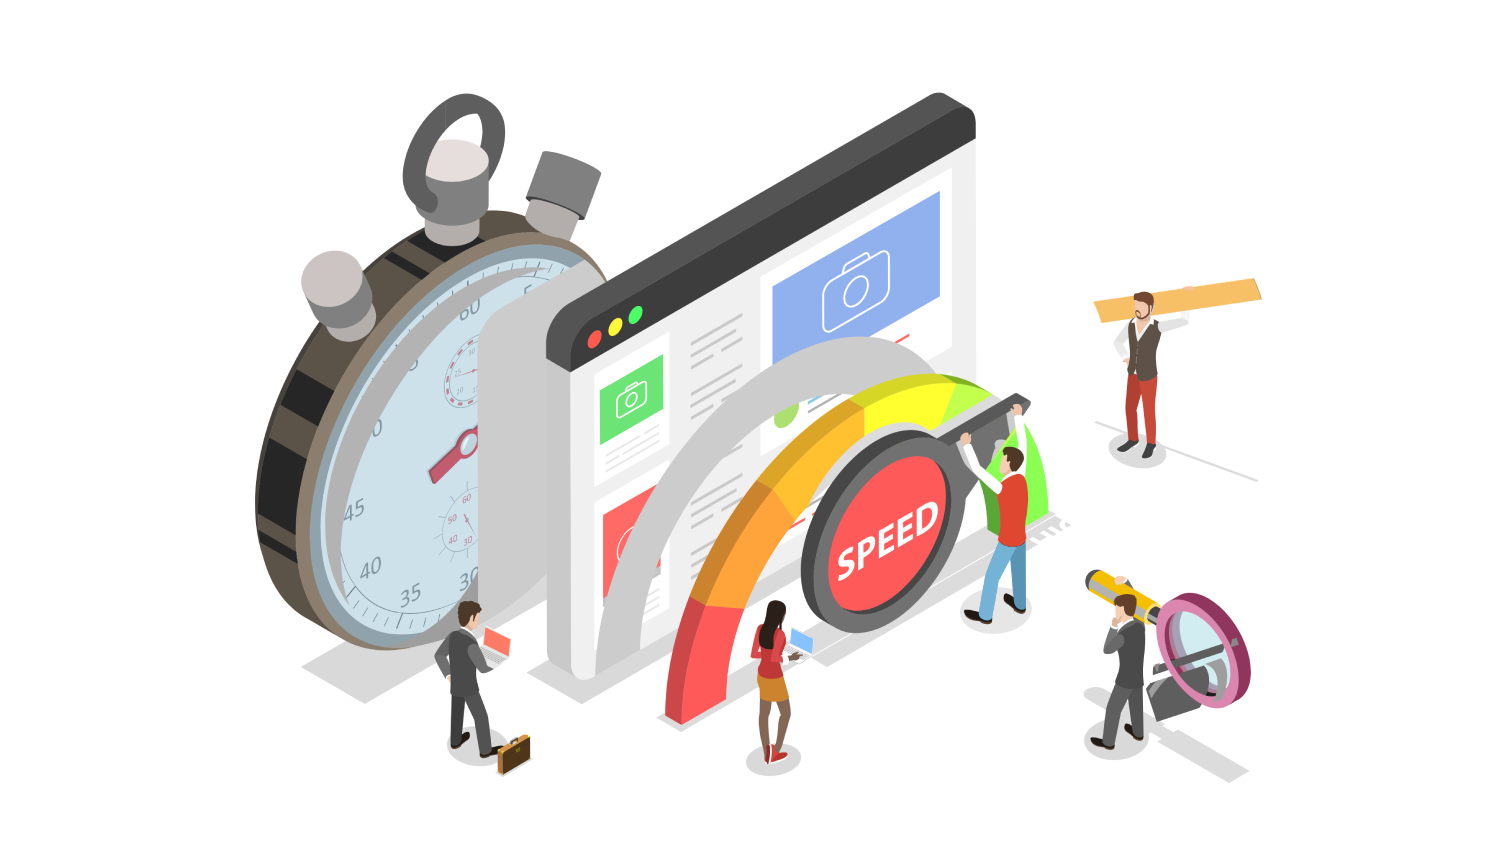
Someone lands on your homepage. Four seconds pass. They’re gone before your headline even finishes rendering.
You won’t see this in your analytics as one alarming red flag. It shows up as a bounce rate that’s a few points higher than it should be, a conversion rate that never quite matches your traffic, a revenue line that’s smaller than the math says it should be. Spread across thousands of visits, the damage is real, just invisible until someone adds it up.
This is that add-up: real numbers on what a slow page actually costs you, and what it means for a WordPress site specifically.
What slow pages actually cost
One of the earliest and most widely cited examples came from Amazon. Former Amazon engineer Greg Linden described A/B tests where small, deliberately introduced delays produced measurable drops in revenue, a finding later summarized, and repeated across the industry ever since, as roughly 1% fewer sales for every additional 100 milliseconds.
It’s a striking anecdote more than a scientific law, but it set the tone for two decades of the same conclusion, echoed by company after company since: speed sits directly on top of revenue, not off to the side of it.
On a WordPress site, that cost rarely comes from one dramatic decision. It accumulates, a theme script here, a page builder bundle there, a plugin nobody quite remembers installing, until the total is measured in seconds, not milliseconds. The rest of this article breaks down exactly where that shows up, and what to do about it.
How page speed affects bounce rate
A bounce isn’t really a considered decision. Nobody weighs your value proposition and decides to leave, they get bored waiting and tap back before the page has rendered anything worth judging.
Google and SOASTA trained a model on real traffic from a large sample of mobile e-commerce sites to measure exactly how much load time influences that decision. The pattern was steep:
| Load time increase | Increase in bounce probability |
| 1s → 3s | 32% |
| 1s → 5s | 90% |
| 1s → 10s | 123% |
Google’s own mobile research, based on data gathered back in 2016, found that 53% of mobile visits were abandoned once a page took more than three seconds to load. The data is nearly a decade old, so it shouldn’t be treated as a live 2026 benchmark, but the broader lesson still holds: on mobile, visitors don’t give a slow page much time to prove itself.
On WordPress, this tends to show up first on category and archive pages, the ones carrying product grids, sliders, or a page builder’s heaviest sections, and worst on mobile, where a desktop-sized hero image or an unoptimized carousel can quietly add seconds nobody notices until they check the numbers.
How page speed affects conversions
Bounced visitors can’t convert, but the visitors who stick around are affected too. Portent analyzed more than 100 million page views across 20 B2B and B2C websites, over 27,000 landing pages and 5.6 million sessions, and found a steep, consistent relationship between load time and conversions. In its e-commerce sample:
| Load time | Average e-commerce conversion rate |
| 1 second | 3.05% |
| 2 seconds | 1.68% |
| 3 seconds | 1.12% |
| 4 seconds | 0.67% |
Pages loading in one second were associated with an e-commerce conversion rate more than four times higher than pages loading in four seconds. That doesn’t mean shaving three seconds off any one website will automatically multiply its conversion rate by four, this is aggregated data across many businesses, not a controlled test on a single site, but the direction is hard to argue with.
On a WooCommerce store, this relationship matters most on high-intent pages such as product, category, and checkout pages. Portent’s data doesn’t mean every store will jump from a 0.67% to a 3.05% conversion rate by cutting three seconds, but it shows how strongly faster load times are associated with better transaction rates.
How page speed affects revenue
Bounce rate and conversion rate are the mechanism. Revenue is where it lands.
Google and Deloitte’s Milliseconds Make Millions study analyzed mobile site data from 37 retail, travel, and lead-generation brands over a 30-day period. Across the study, a mobile speed improvement of just 0.1 seconds, barely perceptible to a person, was associated with:
- 8.4% higher retail conversion rates, and 9.2% higher average order value
- 10.1% higher travel conversion rates
- 8.3% better bounce rates on lead-generation pages
That’s a pattern observed across many brands, not a single controlled test, but it’s consistent enough, across enough different companies, that the direction is hard to dismiss as coincidence.
For a WordPress store or lead-gen site, the encouraging part is that performance improvements don’t necessarily require a redesign. Caching, properly sized images, and better asset delivery can all reduce the time visitors spend waiting without changing how the site looks.
How fast is “fast enough”?
There isn’t one universal load-time number where conversions suddenly fall off a cliff, the data above is a curve, not a cutoff. Google does provide a useful baseline through Core Web Vitals. To assess whether a page delivers a good experience for most users, Google looks at the 75th percentile of page loads, separately across mobile and desktop:
- Largest Contentful Paint (LCP) — how long the main content takes to appear. 2.5 seconds or less.
- Interaction to Next Paint (INP) — how long the page takes to respond after a visitor taps or clicks something. 200 milliseconds or less.
- Cumulative Layout Shift (CLS) — how much the layout jumps around while the page loads. 0.1 or less.
Core Web Vitals are also relevant to Google Search, but that’s a separate conversation from what this article is about. The business case for improving them stands on its own.
How to tell if speed is quietly costing you money
Most sites never diagnose this, because the loss doesn’t announce itself. Running a proper speed audit comes down to a few specific checks:
- Segment your analytics by device. If your mobile bounce rate and conversion rate are meaningfully worse than desktop, and your mobile load time is also meaningfully worse, that’s not a coincidence.
- Compare field performance against your funnel. Search Console’s Core Web Vitals report groups URLs with similar real-user performance rather than tracking every individual page, so you’re looking at problem groups and page templates more than single URLs. Cross-reference your worst-performing groups against where visitors actually drop out — landing pages, product pages, checkout, or a signup form.
- Prioritize by intent, not traffic. A slow blog post costs you less than a slow product page or checkout flow. Start with the pages closest to a conversion.
- Test on a throttled connection, not your office Wi-Fi. Chrome DevTools can simulate a mid-range phone on a slow connection. What looks instant on your laptop can take five or six seconds for a real visitor.
Closing the gap
The good news is that most of what drags a WordPress site down falls into a short, well-understood list, and many of the most common causes can be improved without changing your site’s design.
- Page caching. Without an effective page cache, WordPress may need to run PHP and database queries to generate the same page repeatedly. A cached response avoids much of that repeated work.
- Critical CSS. Large stylesheets can delay the first render, because the browser needs the CSS required for visible content before it can paint the page. CSS Critique prioritizes the styles needed above the fold and lets the rest load afterward.
- JavaScript. Old plugins, unused sliders, and third-party scripts added for a campaign that ended a year ago are usually still running on every page load, even the ones that don’t need them.
- Images. Images are often among the largest contributors to page weight, and sending a desktop-sized hero image to a small phone screen wastes bandwidth visitors never needed to download.
- CDN delivery. Serving assets from infrastructure closer to the visitor can reduce network latency, especially when your audience is geographically far from your origin server.
You can work through this list by hand, and for a small site, that’s a reasonable place to start. For most WordPress sites, though, this is exactly what a caching and optimization plugin is for. FastPixel covers all five: full-page caching with automatic cache warm-up, Critical CSS generated per page, JavaScript optimization, image compression and resizing with next-gen formats, and CDN delivery included on every plan. The point isn’t to chase every PageSpeed warning individually, it’s to keep the common performance work running as the site changes.
The bottom line
Every number in this article points at the same thing from a different angle: speed isn’t a technical score sitting in a dashboard somewhere. It’s sitting in your bounce rate, your conversion rate, and your revenue, whether or not anyone on your team has connected the dots yet.
The visitor who left after four seconds didn’t leave a review explaining why. They just left. Multiply that by every visit your site gets, and the case for speed stops being a developer’s pet project and starts being a business one.
FAQs
How much revenue could I actually be losing?
There isn’t one universal percentage you can apply to your own business, the studies above show the shape of the opportunity, not a personal calculator. The more reliable approach is to look at your own analytics: compare conversion rate by device, landing page, and load-time segment, and if you can, measure conversions before and after a real performance change, or test it directly on a high-intent page. That’s the only way to put a defensible number on what speed is costing your specific site.
Does page speed affect my Google rankings too?
Yes, Core Web Vitals are part of Google’s ranking systems. But that’s really its own topic. This article focuses specifically on the direct business case: the conversion and revenue argument for speed holds regardless of what it does for your rankings.
Is mobile speed more important than desktop?
For many sites, yes, especially when mobile accounts for a large share of traffic. Phones also tend to expose performance problems more clearly, since they have less processing power and often run on more variable network connections. Check your own device split first: if most of your visitors are on mobile, that’s where your optimization work should start.
What’s the fastest way to see improvement without a redesign?
Page caching and image optimization are usually the two biggest levers, and neither requires touching your site’s design. Turning on proper caching and compressing and properly sizing images typically produce the most noticeable improvement for the least effort, Critical CSS and CDN delivery build on top of that.



 French
  English