PageSpeed Insights vs. GTmetrix vs. Lighthouse: Why the Same Site Gets Three Different Scores

You test your site on Google PageSpeed Insights and it hands you a 99. Nice. So you paste the same URL into GTmetrix, and it comes back with a Grade A.
Then, just to be thorough, you fire up Lighthouse in Chrome. Same page. This time it says 94.
Three tools, one website, one testing session, and not a single number that matches.
The natural reaction is to ask which tool is telling the truth. That’s the wrong question, though, and here’s why.
Not one of them is broken. They just measure speed from different places, over different connections, with different assumptions baked in about what a “typical” visitor looks like. Figure out what each one is actually doing under the hood, and those mismatched scores stop being frustrating. They start telling you something.
So let’s pull them apart. How each tool works, why the numbers drift, and how you read all three together instead of trusting one and ignoring the rest. Every example below comes from real reports run on fastpixel.io.
The three tools at a glance
Start with the part almost nobody mentions: for lab testing, all three rely on Lighthouse or Lighthouse-based audits.
The difference is the environment around that audit, where it runs, what device and connection get simulated, and whether real-user data gets included. That’s why they report many of the same performance metrics, including LCP, CLS, FCP, TBT, and other Lighthouse diagnostics.
One thing worth getting straight early, because it trips people up: Core Web Vitals specifically refer to LCP, INP, and CLS. Metrics like TBT and FCP show up in these reports too, but they aren’t Core Web Vitals. TBT is a lab metric used as a proxy for interactivity, and FCP is a performance metric, useful, but not part of the official trio Google measures for ranking.
With that cleared up, here’s the quick version before we get into each one:
| Tool | Where it tests from | Data type | Best for |
| PageSpeed Insights | Google’s servers | Lab + real-user (CrUX) | Diagnostics + Google’s real-world view |
| GTmetrix | Location you choose | Lab | Detailed waterfalls, location control |
| Lighthouse | Your own machine | Lab | Quick local checks, debugging |
Google PageSpeed Insights
Of the three, PageSpeed Insights (PSI) sits closest to Google itself, which makes it especially useful when you care about Core Web Vitals and SEO.
It does two things at once, and it’s important to keep them separate. It runs a Lighthouse audit on Google’s own servers, which produces the lab Performance score in the diagnostics section. And it pulls in field data from the Chrome User Experience Report (CrUX), real numbers gathered from actual Chrome users who’ve loaded your site.
Those two halves answer different questions. The lab score is a diagnostic, it shows how the page behaved in a clean, controlled test, and it’s great for spotting what to fix. The field data is the reality check, it shows whether real visitors are actually passing Core Web Vitals.
And for SEO, the field data is the half that counts, because Google uses real-world Core Web Vitals as part of its page experience signals. Green field data in PSI is a strong sign your site is meeting Google’s real-world performance thresholds.
Here’s fastpixel.io run through PageSpeed Insights:
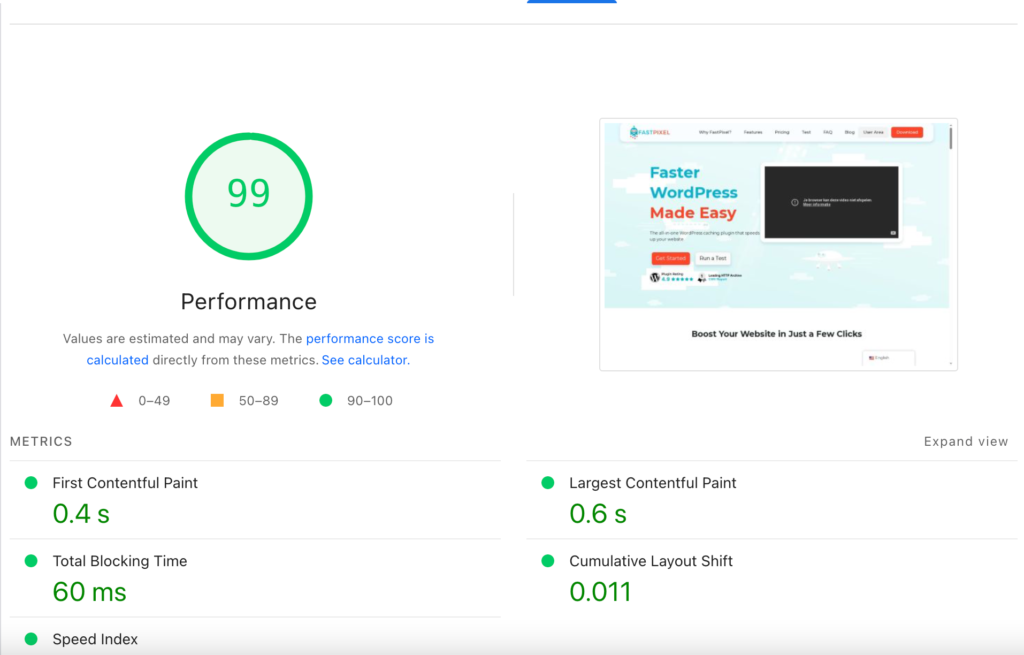
A 99 on the lab score. LCP at 0.6s, CLS at 0.011. Everything comfortably in the green.
Worth flagging one quirk: PSI won’t always give you the exact same score twice. The field data changes gradually as CrUX data updates over time, and the lab test runs on shared Google hardware whose load shifts through the day. A point or two of movement between runs is normal, not a bug.
GTmetrix
GTmetrix has held a soft spot in the WordPress community for years, and the reason is simple, it shows its work. Where other tools hand you a number, GTmetrix hands you the whole report.
It’s Lighthouse underneath, same as the rest, but it runs that audit in its own controlled environment and wraps the results in its own presentation: a letter grade, a separate Structure score, and waterfall charts that lay out exactly how and when each file loads.
The feature that actually makes it valuable, though, is test location control. Even on a free account, you pick which region runs the test.
People underestimate how much this matters. Run a US-hosted site from an Australian test server and the extra distance alone will slow your times down, even though you didn’t touch a single thing on the site.
Here’s fastpixel.io tested through GTmetrix from Seattle:
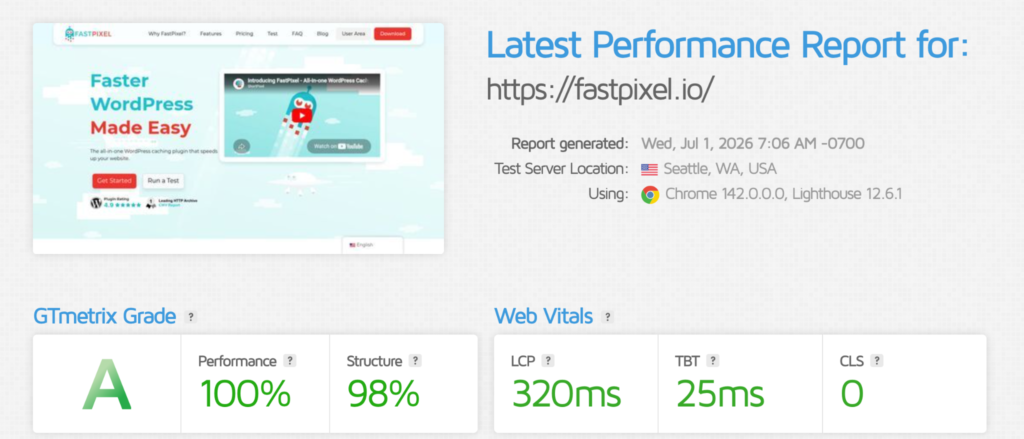
Grade A. Performance 100%, Structure 98%. LCP at 320ms, CLS a flat 0.
And notice what the report tells you up front, Seattle server, Chrome 142, Lighthouse 12.6.1. It doesn’t hide the conditions behind the score. That’s precisely what makes GTmetrix such a good debugging companion: you always know what you were measuring.
Lighthouse
Lighthouse powers the other two, but nothing stops you from running it directly, and the easiest way is the Lighthouse tab in Chrome DevTools. When you’re mid-edit on a page, it’s the quickest read you’ll get.
There’s a catch worth knowing. Run Lighthouse locally and it borrows your CPU and your connection to do the test.
So the same page can score one way on a fresh desktop wired to fiber and noticeably worse on a laptop juggling dozens of tabs over weak Wi-Fi. Lighthouse throttles things to smooth this out, but your local conditions still bleed into the result.
Which is also why one location never tells the full story. Speed genuinely changes depending on where someone is. A reader in Tokyo and a reader in Frankfurt can have completely different experiences, all down to where your server and CDN edges happen to sit.
Test across a spread of regions and you get something far closer to the truth. For the regional comparison below, we used Lighthouse-based tests from multiple locations rather than a single local DevTools run, since Chrome DevTools tests from one place only:
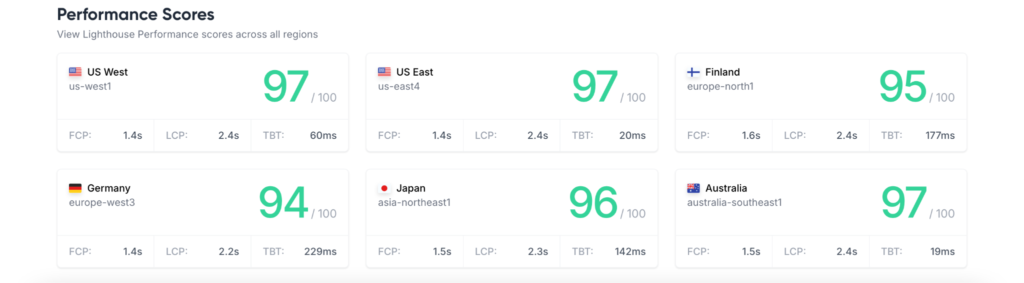
Six regions, and fastpixel.io stays between 94 and 97 the whole way through. Green everywhere.
The little dips, Germany at 94 with a heavier TBT, Australia at 97, aren’t the site changing. They’re distance and local network conditions doing their thing. Holding steady like that across the planet is exactly the result you’re after.
Why the same site scores differently
Circle back to that opening confusion and it finally clicks. Line up the LCP for fastpixel.io across all three:
- PageSpeed Insights: 0.6s
- GTmetrix (Seattle): 320ms
- Lighthouse (multi-region): 2.2s – 2.4s
One site, one session, three LCP numbers that barely resemble each other. Four things explain it.
Location. Every tool tests from somewhere different. Sit the test server near your host and times look fast; move it far away and they slow down. GTmetrix let us plant it in Seattle. The multi-region Lighthouse run does the opposite on purpose, reaching for distant locations that pile on latency.
Simulated network and device. Each tool throttles the connection and CPU its own way to model an “average” user. But “average” is a judgment call, and different judgment calls land on different numbers.
Lab versus field. PageSpeed shows real CrUX data alongside its lab score, so it reflects what actual visitors experience, not just one controlled run. The other two are lab-only.
Plain variance. Even the same tool, run twice back to back, can shift a little, server load, cache state, network jitter. That’s the whole reason “run it 3 to 5 times and take the median” is standard advice rather than fussiness.
So no, nothing here is lying to you. Each one’s just answering a slightly different question.
Which tool should you trust?
Short answer: all of them, for different jobs.
- PageSpeed Insights is your closest view of Google’s real-user performance data. Its field data mirrors what Google actually sees from real visitors, and those Core Web Vitals are part of Google’s page experience signals. The lab score alongside it is handy for diagnostics.
- GTmetrix is your debugger. The waterfalls and Structure breakdown point straight at what’s slow and why, and the location picker lets you see how a specific region experiences the site.
- Lighthouse is your scratchpad. Tweaking a page? Pop it open in DevTools and get an answer without breaking stride.
Stop hunting for one perfect number. Look for agreement across all three instead. A site that holds up everywhere, like the fastpixel.io runs above, is genuinely fast. A site that scores 95 in one tool and 60 in another almost always has a location or infrastructure problem hiding somewhere, and that gap is your first clue.
Testing an optimized site
The fastpixel.io results above are useful because they show what consistency looks like across tools. The exact numbers change from one environment to the next, but the important part is that the site stays in the green across PageSpeed Insights, GTmetrix, and multi-region Lighthouse tests.
That consistency is what optimization should be aiming for: not one perfect score, but strong results across different tools, devices, and locations.
Here’s the practical move for getting there. Test before you optimize to lock in a baseline, then test after across all three tools. A site that’s genuinely faster should improve across multiple tools over time, not just in the one report you happened to check.
And that’s the case for handling optimization in one place rather than stitching it together from parts. FastPixel takes on the work that moves these metrics, page caching, Critical CSS, image optimization with WebP conversion, CSS and JS minification, and CDN delivery, and it runs all of it in the cloud. Because the heavy lifting happens off your server and delivery is handled through a CDN, performance is more likely to stay consistent across different locations, whether that’s Seattle, Frankfurt, or Tokyo.
How to test your own site the right way
Want results you can actually rely on? A handful of habits get you there:
- Test the same page in every tool. Comparing your homepage in one and a product page in another tells you nothing.
- Run each test 3–5 times and take the median. One run is an anecdote, not data.
- Match the test location to your real audience. Mostly European visitors? A European test server tells you far more than a US one ever will.
- Clear your cache between real changes. Otherwise you’re grading a stale version rather than the change you actually made.
- Keep an eye on PSI’s field data over time. Lab scores land instantly; real-world Core Web Vitals need time and traffic to update, and they’re the numbers most relevant to Google’s page experience assessment.
Get all this straight and the pile of contradictory scores turns into something useful, a layered, honest picture of how your site really performs.
Test with all three. Read each for what it’s good at. Aim for green everywhere.
FAQs
Why does PageSpeed Insights give me a different score every time I run it? Two moving parts. The lab test runs on Google’s shared hardware, which speeds up and slows down with load, and the CrUX field data is based on aggregated real-user data over time, so it changes gradually as new data replaces older visits. A little movement between runs is expected. Run it a few times, take the median, and don’t read too much into a single number.
Which score matters most for SEO? The lab Performance score isn’t itself a ranking metric. The more relevant part is the real-world Core Web Vitals field data from CrUX, which Google uses as part of its page experience signals. That’s why the field numbers matter more than the lab score for SEO, and why changes you make take a few weeks of traffic to show up there.
Why is my GTmetrix LCP so different from my PageSpeed Insights LCP? Mostly location and network simulation. GTmetrix tests from whatever region you pick; PageSpeed’s field data reflects real users from all over. Choose a GTmetrix server far from your host and the number climbs. Point it at wherever your actual audience lives for a result that means something.
Is a lower Lighthouse score in Chrome DevTools a problem? Not on its own. Local Lighthouse runs on your CPU and your connection, so a loaded machine or weak Wi-Fi drags the score down even when real visitors are having a fine experience. Lean on it for quick checks while you work, and let PageSpeed’s field data be the final word.
Are TBT and FCP Core Web Vitals? No, and it’s a common mix-up. Core Web Vitals are LCP, INP, and CLS. TBT is a lab metric used as a proxy for interactivity, and FCP measures how quickly the first content appears. Both are useful diagnostics you’ll see in these reports, but neither is one of the three metrics Google uses to assess real-world experience.
What score should I be aiming for across all three? Consistency beats any single figure. Shoot for 90+ in PageSpeed Insights, an A in GTmetrix, and green Core Web Vitals everywhere, LCP under 2.5s, INP under 200ms, CLS under 0.1. A site that holds up in every tool from every region is genuinely fast, and that was always the point.
Boost Core Web Vitals and performance with FastPixel!
Optimize loading times, enhance user experience, and give your website the performance edge it needs.